

I recently posted a comparison of my bike tests over the years, along with a fairly blunt observation: an hour a day of training, a stressful job, and being in my mid-40s had left me with a pretty shitty lactate curve! The sort of curve that generally makes folks not want to even do the test. And believe me, going in, I had my second thoughts - “I already know I’m out of shape”, “I know this is going to be flat-out depressing when compared to some of my younger curves” etc. etc. But, I did it anyway, and now, looking back, I’m glad I did. Because it’s the “shitty” tests that offer perspective on how fitness changes when training is reduced. It’s the “shitty” tests that give you a “never again” floor that you vow never to return to.
The good news? My curve looked considerably better at 50 than it did at 45! And the difference wasn’t more suffering. It was more easy movement. After just three months of changing things, my whole curve had already shifted ~20 W to the right and that ugly straight line was starting to look like a curve again!
The obvious interpretation of the age-45 test was that I wasn’t particularly fit by my own historical standards. But this wasn’t just a problem with the watts I could put out. It was a dire warning about the metabolic machinery supporting those watts. That’s why I used the word unhealthy in my tweet and why lactate testing deserves a much bigger role in our conversation about health…
A lactate curve tells us something about the athlete. It also gives us a window into the metabolism that is keeping the athlete going!
Throughout The Endurance Code I talked about how intertwined metabolic health is with our overall health. The number of mitochondrial “energy factories” within the muscle, how well they operate, and what fuel they run on all matter. When those factories start to splutter or shut down due to disuse, the consequences reach well beyond our race results!
Now, this curve alone wasn’t a diagnosis of diabetes, metabolic syndrome, or a mitochondrial disease. It was, however a warning sign of where things are heading - evidence consistent with some of my factories shutting down, leading to others struggling to keep up with the load - and, to me, a good reason to take my metabolic health seriously rather than dismiss the whole thing as “getting older” as so many do!
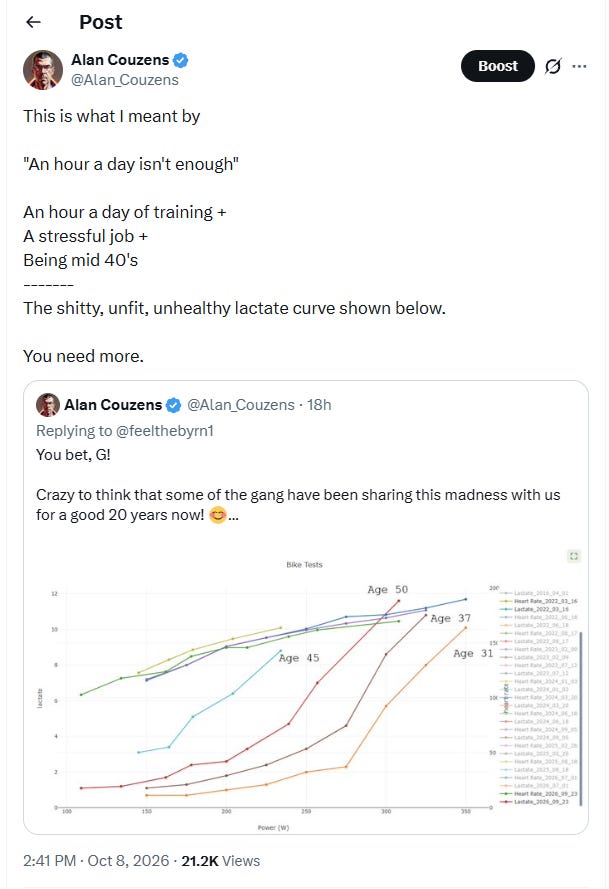
Figure 1. The tweet that started this discussion. The age-45 lactate curve rises early and sits well above my better curves at comparable power outputs. The chart also includes heart-rate traces at the top - which are much more closely aligned. While my cardiac fitness only changed slightly through the tests, the health & fitness of my lactate-gobbling mitochondria within the muscles changed substantially!
What was actually wrong with that curve?
Look at the early part of the age-45 curve. Lactate is already elevated at workloads that fitter me handled with considerably less accumulation. As the watts increase, it climbs immediately - it’s basically not a lactate curve, it’s a lactate straight line! My better curves show a substantial working range where lactate stays low and stable, with the mitochondria keeping up with the load.
For an endurance athlete, that shrinking working range is obviously bad news. But why is lactate accumulating so early? The answer takes us directly into how much lactate we produce and how effectively we use it.
The usual “lactate equals waste product” explanation gets us into trouble here. Lactate is a usable fuel and a signaling molecule, produced and used under fully aerobic conditions. A fit athlete can turn over a lot of it while maintaining a relatively low blood concentration. San Millán and Brooks explain this distinction in the paper we’ll look at below.
Think of a busy train station. A crowded platform tells you about the balance between arrivals and departures, not how many passengers traveled through all day. Blood lactate reflects that same balance between appearance and removal. A busy station with enough trains keeps people moving; too few trains and the platform fills up - just like my age-45 curve…
Low lactate at a useful workload can reflect a very capable fuel-processing system!
The paper that connects fitness and metabolic health
Mitochondria also do the work of burning fat - no mitochondria, no fat burning! Metabolic flexibility is our ability to adjust fuel use to demand: burn fat at low intensity, increase carbohydrate use when the work requires it, and move between the two. That flexibility depends on the number and health of our mitochondria. The concern is losing the ability to fuel low-intensity movement with fat, leaving us leaning on carbohydrate even when we’re barely working.
In their 2018 paper in Sports Medicine, Iñigo San Millán and George Brooks compared three groups: 22 professional male cyclists, 20 moderately active men, and 10 men with metabolic syndrome - clinically diagnosed insulin resistance or Type II diabetes. These were very different populations, deliberately chosen to examine a wide range of metabolic capabilities.
The researchers increased cycling power by approximately 35 W every 10 minutes, measuring blood lactate and respiratory gases. Those gas “exhaust fumes” let them estimate fat and carbohydrate oxidation alongside the lactate response. Here’s what they found…
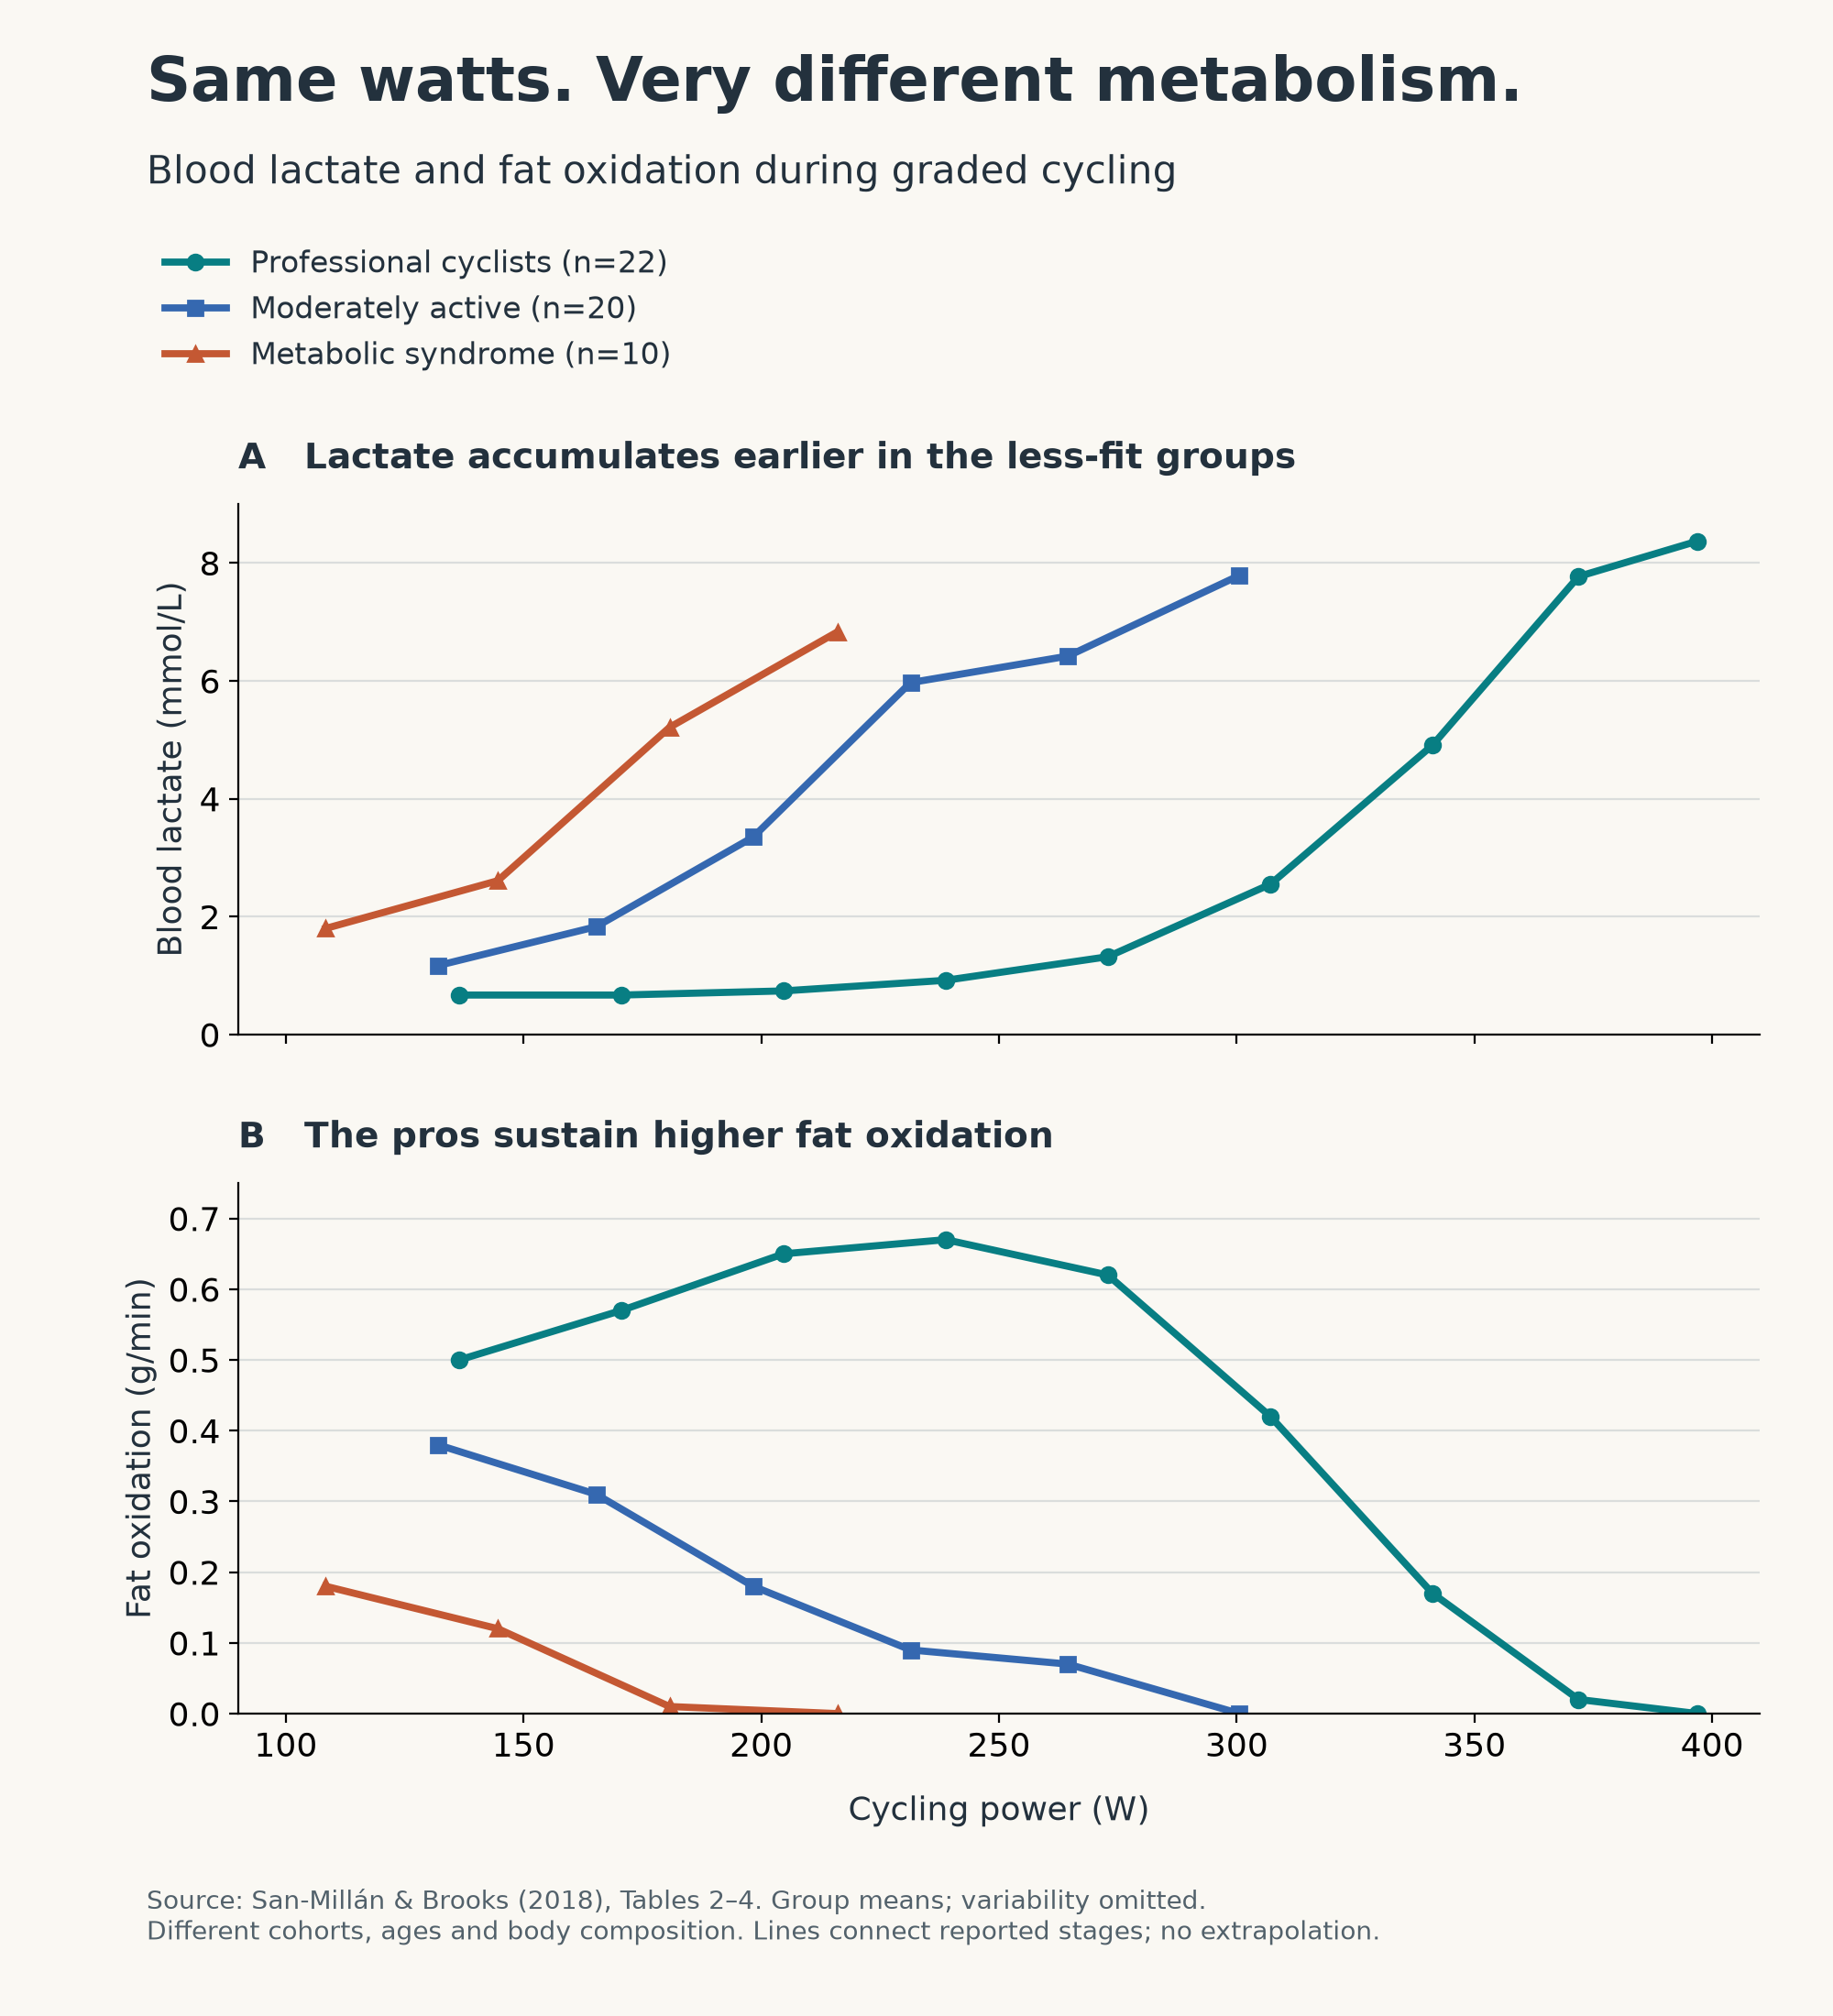
Figure 2. Original redraw from Tables 2–4 in San Millán and Brooks (2018). Points are reported group means; lines connect the measured stages. Variation around the means is omitted for readability. The groups differed in age, body composition and fitness, and the same watts represented different relative intensities. These aren’t three stages of one person’s decline.
The pros maintained low lactate while doing A LOT of work, with high fat oxidation through much of the test. The moderately active men accumulated lactate earlier and lost fat oxidation sooner, but still showed a “quasi curve.” The metabolic-syndrome group, like 45-year-old me, had something much closer to a straight line! Even their highest tabulated fat oxidation was only 0.18 g/min - about 1.6 kcal/min - leaving carbohydrate to carry most of the load at very low outputs.
Here are selected stages from the paper:
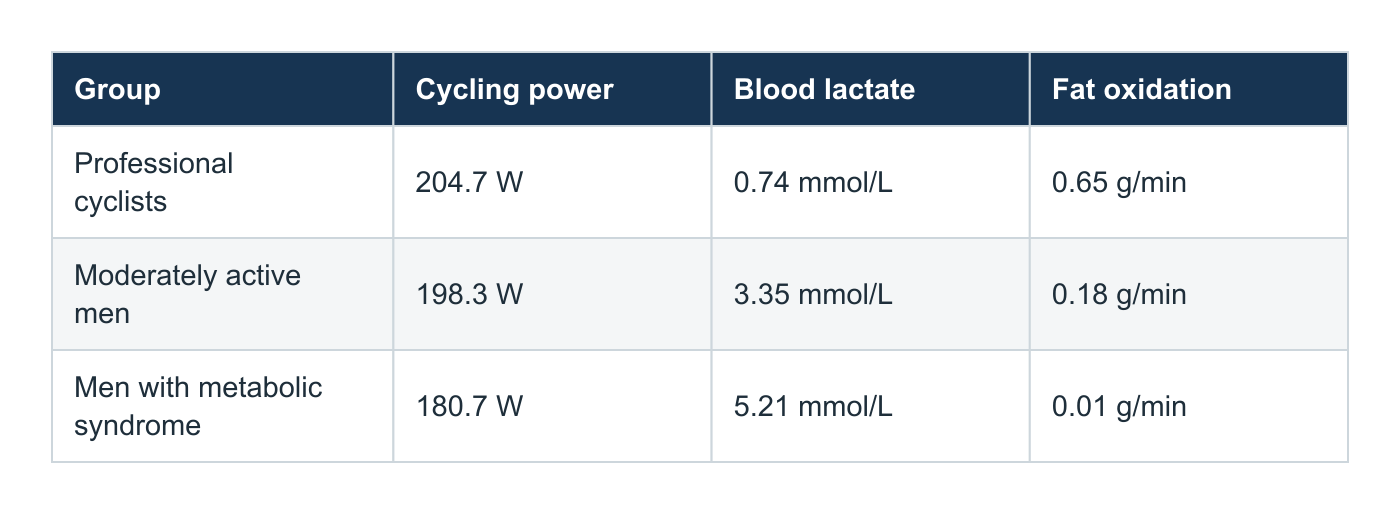
Table 1. Selected group means from Tables 2–4. These are nearby measured stages, not an exact workload match or individual diagnostic cutoffs. Fat oxidation was estimated from respiratory gases.
At roughly 200 W, the pros were oxidizing about 3.6 times as much fat as the moderately active group, with much lower blood lactate. Meanwhile, at an even lower absolute workload, the metabolic-syndrome group was already showing almost zero measured fat oxidation. The same general activity - turning the pedals - was placing very different demands on these bodies!
Across all observations, blood lactate and fat oxidation were inversely associated: r = -0.76. It’s a strong connection between what we see in that little drop of blood and how the body handles its fuel…
Your lactate response contains very valuable information about how the body handles fuel supply at different workloads and your consequent metabolic health!
San Millán and Brooks proposed these responses as an indirect assessment of metabolic flexibility and mitochondrial oxidative capacity. Their study didn’t use muscle biopsies or directly measure lactate turnover with tracers. But for ~$200 and the cost of a few strips, we have an accessible indicator to check several times a year, through the years - even when we don’t especially want to :)
So, were my mitochondria unhealthy?
At 45, my oxidative machinery was underdeveloped and leaning on carbohydrate earlier than it should. Despite ~1 hour of training per day, my baseline lactate was already >2 mmol/L before exercise, and even low outputs sent it in one direction... up! The San Millán paper, coupled with my previous metabolic tests, put that pattern in context. “Metabolically unhealthy” captures exactly why it concerned me.
Was I short of mitochondrial factories, or were the ones I had working poorly? The authors discuss limited mitochondrial mass rather than impaired coupling efficiency in their metabolic-syndrome group. Either way, my practical response was the same: move more and get my lactate and fat oxidation heading in the right direction!
A 2024 San Millán and colleagues preprint takes the question into the muscle itself. In 19 people - nine sedentary and ten moderately active - muscle biopsies showed lower mitochondrial respiration in the sedentary group, alongside poorer exercise metabolic responses. That connects three levels of the story: lactate, fuel use, and measured mitochondrial function.
This is why the curve matters beyond sport. It gives us a practical window into the metabolic machinery implicated in insulin resistance, type II diabetes and other serious health problems - without needing a muscle biopsy! I wasn’t willing to watch that machinery deteriorate while congratulating myself for ticking the exercise box…
That curve gave me a reason to improve my metabolic capacity. I didn’t need to wait for it to become a medical diagnosis!
But I was training an hour a day!
This was the point of the tweet. An hour a day sounds like a lot, particularly when you’re fitting it around a stressful job. Yet my test was telling me that the combination of training and life I had at the time wasn’t producing the aerobic capacity I wanted. My body definitely wasn’t awarding me any bonus mitochondria for having a packed calendar!

An hour on the training log is part of the story. The mitochondria would like to discuss the rest of the day.
To be clear about the dose, it’s impossible to pull apart the interplay of stress and a lack of movement in what I saw on my lactate straight-line. If I had a zen life for my other 23 hours and managed an hour a day of low-intensity exercise on top of that would I have seen the same curve? Maybe, maybe not. However, in my experience as a coach and exercise physiologist, that curve, for that training volume is not atypical. A triathlete who ‘only’ has time to train for 7 hours per week generally doesn’t have that nice prototypical exponential curve that we like to see - whether through the low movement or the stress implications implied by the “7 hour a week” lifestyle, in my experience, it rarely leads to strong metabolic fitness or a nice looking lactate curve.
What I’d also say is that those who are struggling to fit in an hour a day of training are often also struggling to fit in the required recovery to adapt and respond to that training. In this sense, while...
The training log records what we did. The lactate curve shows us what we adapted to!